How to Use Prometheus and node exporter for Server Metrics
Install node exporter as a systemd service, scrape it with Prometheus, write PromQL for CPU, memory and disk, and keep the port private.
Shell checks tell you something is wrong now; metrics tell you what changed over the last week. Prometheus collects numbers by pulling them from small exporters, and node_exporter is the standard one for Linux hosts. It is the step after basic alerting with scripts. Versions: node_exporter 1.8 and Prometheus 3.0 on Debian 13.
Install the exporter
sudo useradd --system --no-create-home --shell /usr/sbin/nologin node_exporter
cd /tmp
curl -fsSLO https://github.com/prometheus/node_exporter/releases/download/v1.8.2/node_exporter-1.8.2.linux-amd64.tar.gz
tar xzf node_exporter-1.8.2.linux-amd64.tar.gz
sudo install -m 755 node_exporter-1.8.2.linux-amd64/node_exporter /usr/local/bin/[Unit]
Description=Prometheus node exporter
After=network-online.target
[Service]
User=node_exporter
ExecStart=/usr/local/bin/node_exporter --web.listen-address=10.0.0.5:9100
Restart=on-failure
[Install]
WantedBy=multi-user.targetsudo systemctl daemon-reload && sudo systemctl enable --now node_exporter
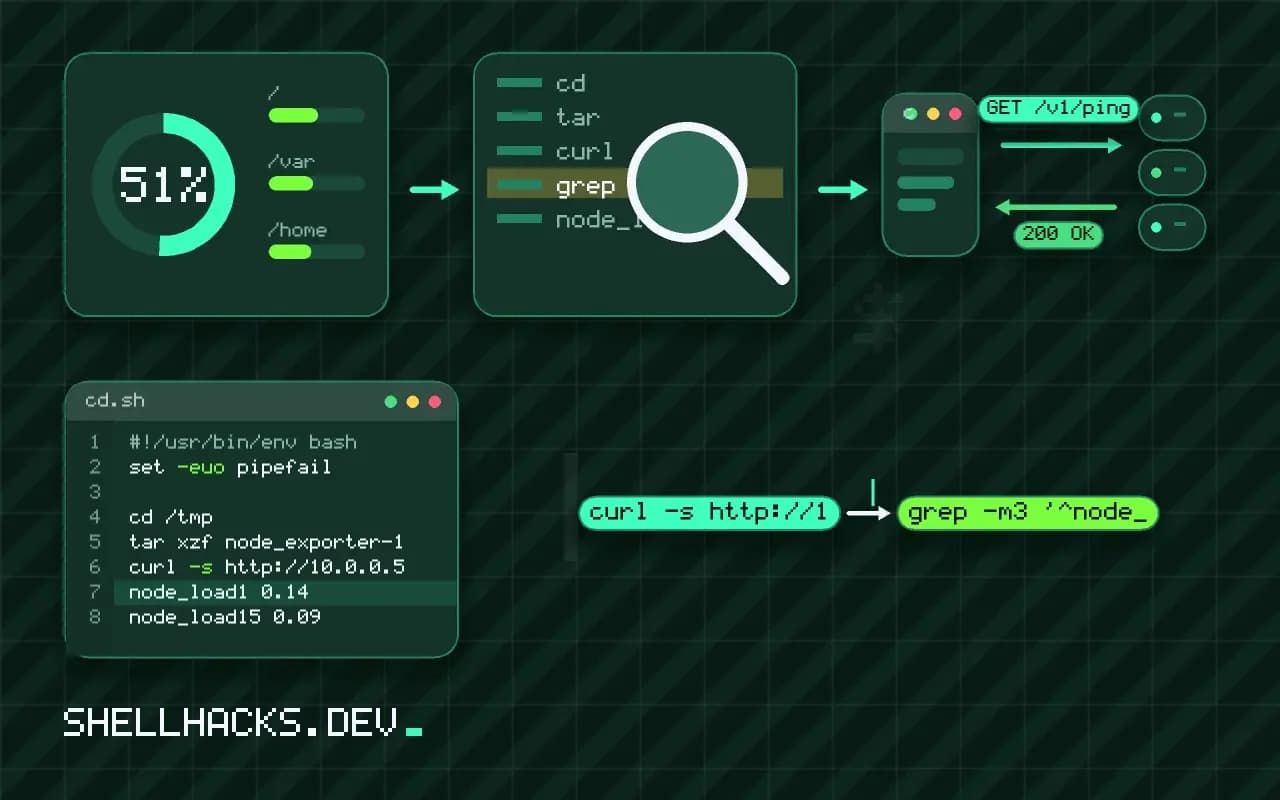
curl -s http://10.0.0.5:9100/metrics | grep -m3 '^node_load'node_load1 0.14
node_load15 0.09
node_load5 0.11
Verify the archive checksum against the release page first. The listen address is the private IP, not all interfaces, because the metrics list mounts, kernel versions and network interfaces. Check releases for the current version before copying the URL.
Scrape it
global:
  scrape_interval: 30s

scrape_configs:
  - job_name: node
    static_configs:
      - targets: ["10.0.0.5:9100", "10.0.0.6:9100"]
Reload Prometheus and open the Targets page at :9090/targets; each target should show UP. A target that stays DOWN is a firewall or listen-address problem, and the error column says which.
Useful queries
100 - (avg by (instance) (rate(node_cpu_seconds_total{mode="idle"}[5m])) * 100)
node_memory_MemAvailable_bytes / node_memory_MemTotal_bytes
node_filesystem_avail_bytes{mountpoint="/"} / node_filesystem_size_bytes{mountpoint="/"}
rate(node_network_receive_bytes_total{device="eth0"}[5m])
predict_linear(node_filesystem_avail_bytes{mountpoint="/"}[6h], 24 * 3600) < 0
CPU is a counter of seconds spent per mode, so you take the rate of idle time and subtract it from 100. Use MemAvailable, which counts reclaimable cache; MemFree makes every healthy Linux server look nearly out of memory. The last query predicts whether the disk fills within a day by extrapolating the last six hours, a more useful alert than a fixed threshold.
Alerts
groups:
  - name: host
    rules:
      - alert: DiskWillFill
        expr: predict_linear(node_filesystem_avail_bytes{mountpoint="/"}[6h], 24*3600) < 0
        for: 30m
        labels: { severity: page }
The for clause makes the condition hold for 30 minutes before firing, which removes blips. Route alerts through Alertmanager to Slack or ntfy.
Where this does not apply
For two servers, the scripts in the alerting post are less to run. Prometheus needs storage and retention planning, and it does not give logs; see centralizing logs. Expose metrics over TLS and authentication if the network is not private, using the exporter's --web.config.file.
Keep the exporter updated like any other service: it runs as a dedicated unprivileged user, and a release can fix a collector bug or a vulnerability. Add node_exporter to the same patch routine as the rest of the host, and check the release notes for renamed metrics before upgrading, since dashboards and alert rules break quietly when a metric name changes.
What the exporter exposes
The node exporter reads the kernel's counters from /proc and /sys and serves them as plain text at /metrics on port 9100. It reports CPU time per mode, memory, swap, disk space and disk activity, network traffic, load, file descriptors and many more, all as numbers with labels. It does not store anything and does no alerting. Prometheus fetches the page on an interval, typically every 15 or 30 seconds, and stores the samples, so the exporter itself stays tiny and stateless. Most values are counters that only go up, such as total CPU seconds or bytes sent, and what you want is the rate of change, which PromQL computes with rate() over a window. Querying a raw counter gives a number that grows forever and tells you nothing, so remember to wrap counters in rate() or increase().
Run it as a systemd service under an unprivileged account, since it needs no special rights to read most of what it exports. Collectors can be turned on and off with flags, and it is wise to disable the ones you do not use.
Security of the endpoint
By default the exporter listens on all interfaces without authentication, and its output reveals a good deal about the machine: kernel version, mount points, network interfaces, running services if the systemd collector is on. That is useful to an attacker preparing an attack. Bind it to a private interface or to localhost and scrape through a tunnel or an agent, or restrict port 9100 with the host firewall to the monitoring server's address. Recent versions support TLS and basic authentication through a web configuration file passed with --web.config.file, which suits a scrape across an untrusted network. Never expose the port to the internet. Check from outside with a port scan after setup, and remember that container runtimes can publish ports around host firewall rules, so verify the actual reachability.
When the host runs the exporter in a container, mount the host's /proc, /sys and root file system read-only and use the host's PID namespace, otherwise it reports the container and not the machine.
Reading the data without drowning in it
A few queries cover most needs. CPU use as a percentage is one minus the rate of the idle mode, averaged across cores. Memory pressure is better judged from available memory than from free memory, since Linux uses spare memory for cache and the free figure alone looks alarming on a healthy machine. Disk space needs the filesystem filters that drop temporary and virtual file systems such as tmpfs and overlay, or the numbers include things you do not care about. Disk fill prediction uses predict_linear over several hours of samples to estimate when a volume will hit zero, which is far more useful than a fixed threshold. Network error and drop counters show failing links. Keep a small dashboard with these and compare it across hosts, since the odd one out is usually the broken one.
Retention costs disk. With default settings, a few hundred series per host for a month is modest, and scrape interval and retention are the two settings that decide the size. Set both on purpose and measure the storage growth over a week.
Operating the exporter over time
Keep the exporter updated, since new releases fix bugs and add collectors, and check the release notes for renamed metrics, which break dashboards and alerts without any error. Pin the version in your provisioning, and roll out upgrades to one host first. Label hosts with their role and environment in the Prometheus scrape configuration, using static labels or service discovery, so queries can select web servers and not individual names. Check that every host is being scraped by alerting on the built-in up metric, which is 0 when a scrape fails, and treat a missing host as a finding, since a silent exporter is as bad as a failing one. For machines that are behind firewalls or short-lived, the textfile collector lets cron jobs write metrics to a directory that the exporter serves, which turns a backup job's last success time into a metric you can alert on.
Test the alert rules before relying on them. Lower a threshold temporarily, fill a scratch volume or load the CPU, and confirm that the alert fires, the message arrives and the runbook link works.
See the node exporter guide and Prometheus configuration.