How to Use perf stat and perf record for Quick Profiles
Use perf stat and perf record for quick profiles: read the counters, compare runs, sample call stacks, view the report and fix permission limits.
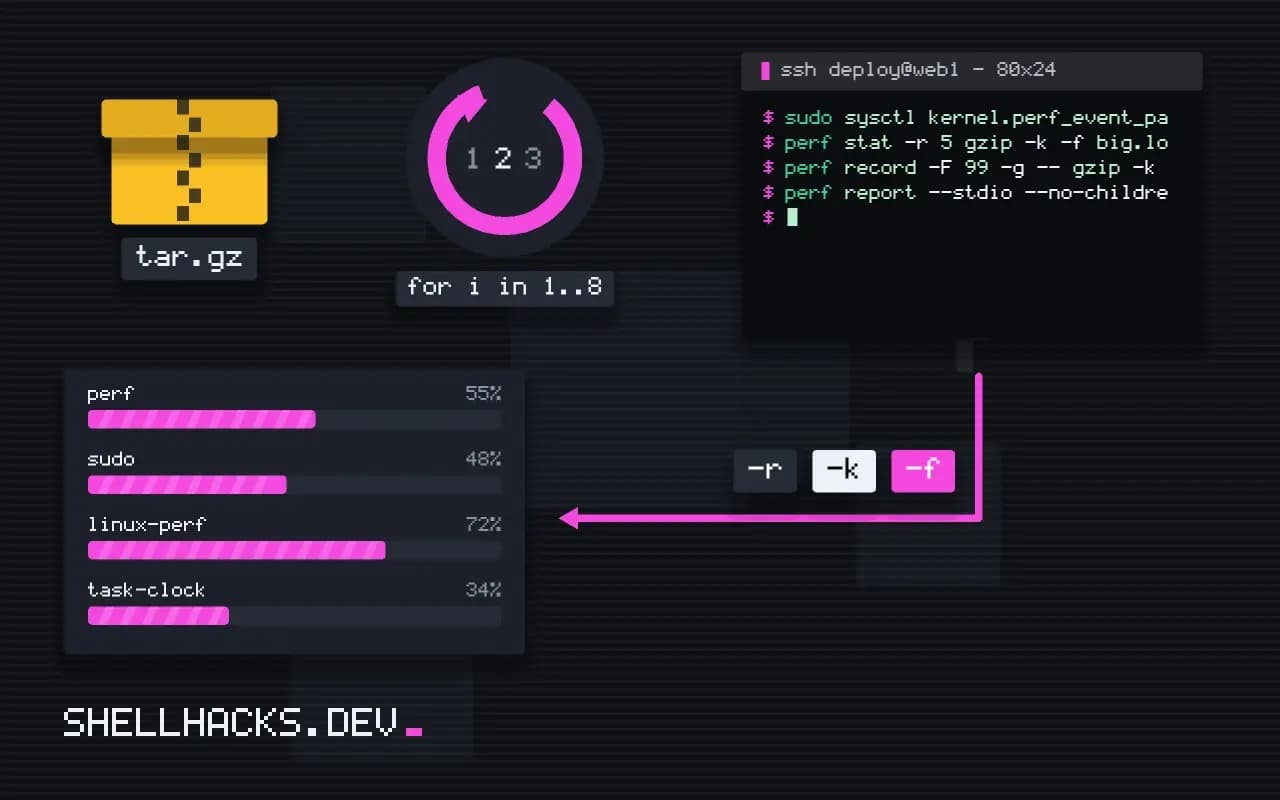
"It is slow" is not a measurement. perf, the profiler built into the Linux kernel tools, turns it into one in two commands: one that counts, and one that samples where the time is spent. It needs no changes to the program and little overhead. This post covers the two commands and the reading of the output, a step beyond benchmarking shell commands. Examples use perf from Linux 6.12 on Debian 13.
Install and permissions
sudo apt install linux-perf
cat /proc/sys/kernel/perf_event_paranoid
sudo sysctl kernel.perf_event_paranoid=1
The package is linux-perf on Debian and linux-tools-generic on Ubuntu. perf_event_paranoid controls access: at 2 or more unprivileged users can only profile user-space code of their own processes, and at 3 or 4 (distribution defaults vary) perf may refuse. Setting 1 allows profiling your own processes including the kernel side; run as root for everything. Lowering it is a security trade-off on shared machines, so restore it afterward.
perf stat: count
perf stat -r 5 gzip -k -f big.log Performance counter stats for 'gzip -k -f big.log' (5 runs):
3,412.55 msec task-clock # 0.998 CPUs utilized ( +- 0.4% )
18 context-switches # 5.275 /sec
0 cpu-migrations # 0.000 /sec
141 page-faults # 41.319 /sec
12,904,118,203 cycles # 3.781 GHz
31,288,507,114 instructions # 2.42 insn per cycle
3,950,114,882 branches # 1.158 G/sec
98,225,611 branch-misses # 2.49% of all branches
3.419 +- 0.014 seconds time elapsed ( +- 0.41% )
task-clock against elapsed time tells you whether the program kept a CPU busy (0.998 CPUs utilized here, so it is compute-bound). IPC is instructions divided by cycles: 2.42 is good for a compression loop; a value below about 1 usually means stalls waiting for memory. A high branch-miss percentage points at unpredictable branches. The +- values come from -r and show how noisy the measurement is, so compare two versions of a program only when the difference exceeds the noise.
perf record: sample
perf record -F 99 -g -- gzip -k -f big.log
perf report --stdio --no-children | head -n 25# Samples: 340 of event 'cpu-clock'
# Overhead Command Shared Object Symbol
52.10% gzip gzip [.] deflate_fast
21.30% gzip gzip [.] longest_match
9.60% gzip gzip [.] fill_window
-F 99 samples 99 times per second, a rate that avoids lining up with timers at 100 Hz. -g records the call stack for each sample so that you can see callers, not only the leaf function. The report shows the share of samples in each function: here half the time is in one function, which is where to look. perf report without --stdio opens an interactive browser; press a to annotate the assembly. Use -p PID to attach to a running process for a few seconds: perf record -F 99 -g -p 4121 -- sleep 15.
Live view
sudo perf top -F 99 -g
perf stat -p 4121 -- sleep 10
perf stat -e cache-misses,cache-references ./app
perf top is a live version of the report for the whole system, like top for functions. perf stat -p measures a running process for ten seconds. Specific events are selected with -e; perf list shows what your machine supports.
Symbols and call stacks
Without symbols the report shows hex addresses. Install debug packages for the binaries you care about, or build with -g. Stack unwinding by frame pointer (-g) fails on code compiled without frame pointers, as many distribution binaries are, and shows truncated stacks; use --call-graph dwarf, which is heavier and gives complete stacks. Debian 13 enables frame pointers in its packages, which improves the default.
Where this does not apply
In a virtual machine or container, hardware counters such as cycles may show <not supported>; software events (task-clock, page-faults) still work, and the sampling falls back to cpu-clock, as in the output above. Perf measures CPU, not waiting on disk or locks: for off-CPU time use other tools. To turn a recording into a picture, continue with flame graphs, and for a first look at a slow server, debugging high load.
What counters and samples are
The two main modes of perf answer different questions. perf stat reads hardware and software counters for the whole run of a command and prints totals: cycles, instructions, cache misses, branch misses, context switches, page faults. It tells you what kind of work the program did, and not where in the code it happened. The ratio of instructions to cycles, called IPC, is the quickest summary: a value near 0.5 suggests the processor spent most of its time waiting, often for memory, while values above 2 suggest it was busy computing. perf record works by sampling: at a fixed frequency it interrupts the CPU, records which function was running and, with the call graph option, the stack that led there, and writes the samples to a file for perf report to summarize. Use stat to decide what kind of problem you have and record to find where it is. A program with a low IPC and many cache misses points at data layout, and one with high IPC and a hot loop points at the algorithm.
Run the measurement several times, with perf stat -r 5, which repeats the command and reports the mean and the spread. A single run on a busy machine is noisy enough to mislead, and the variance tells you how much to trust a difference.
Access, containers and virtual machines
Unprivileged use is controlled by the sysctl kernel.perf_event_paranoid. At the common default of 2 or higher, a normal user can profile only their own processes in user space, and at 3 on some distributions nothing at all. Lowering it to 1 allows kernel samples for your own processes, and root can do anything. Change it in a configuration file under /etc/sysctl.d if you need it persistently, and remember that a lower value exposes more information to unprivileged users, so on shared machines prefer running perf as root for the duration. Inside a container, the call that perf makes is blocked by the default seccomp profile, and you either run it from the host against the container's process ID or relax the profile for a debugging session. In many virtual machines the hardware counters are not exposed, and perf stat prints "not supported" for cycles and instructions. The software events and the time-based sampling mode still work with -e cpu-clock, which is enough for flame graphs.
The package name varies: linux-tools-generic on Ubuntu, linux-perf on Debian and perf on Fedora, and the tool must match the running kernel closely, so a version mismatch error after a kernel update means installing the matching package.
Getting useful stacks and symbols
A profile is only readable if the tool can turn addresses into names and walk the stack. Names come from symbol tables, so a binary built without debug information, or stripped, shows hexadecimal addresses, and the fix is to install the debug symbols package or build with symbols. Stack walking is harder. By default perf record -g follows frame pointers, and most distribution binaries are compiled without them to save a register, so the stacks come out short or broken, with the callers missing. Options are to rebuild with -fno-omit-frame-pointer, to use --call-graph dwarf, which copies a slice of the stack on every sample and unwinds it later using debug information, at the cost of large files and higher overhead, or to use hardware last-branch records where the processor supports them. Pick a sampling rate that is not a round number, such as 99 hertz, so samples do not line up with periodic activity in the program that runs at 100 hertz, which would bias the picture.
Measure the overhead too. Sampling at a high rate with dwarf unwinding can slow a program noticeably, so profile a representative but short run, and compare the timing with and without perf before drawing conclusions about the speed of the program.
See the perf wiki and perf-stat(1).