How to Debug a Kubernetes Pod From the Terminal the Safe Way
Debug a Kubernetes pod from the terminal: status and events, logs of the previous container, exec, ephemeral debug containers, port-forward and common causes.
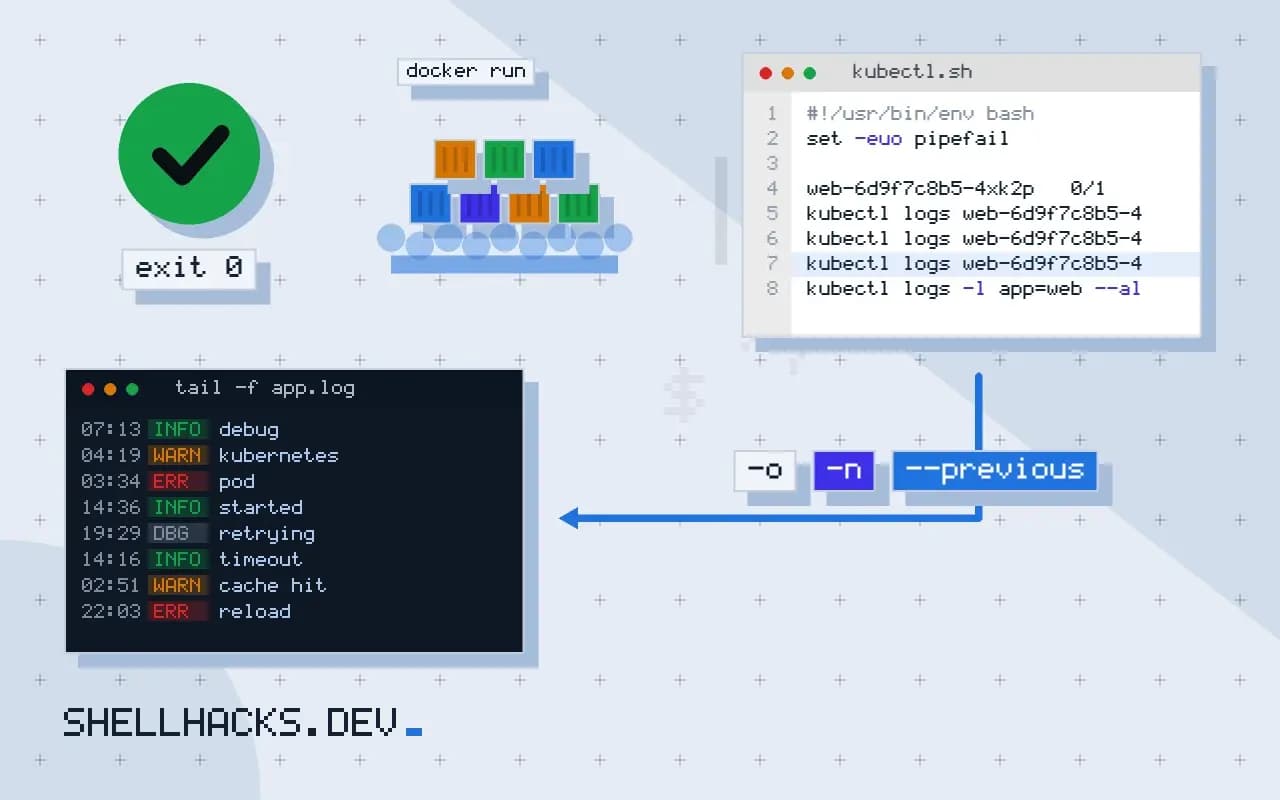
A pod that does not work can fail in five different layers, and the commands to tell them apart are a short fixed sequence. Running through it in order beats guessing. It applies the approach from minimal reproduction to a cluster, and the commands assume kubectl 1.31 with a cluster of the same age.
Step 1: status and events
kubectl get pod web-6d9f7c8b5-4xk2p -o wide
kubectl describe pod web-6d9f7c8b5-4xk2p | sed -n '/Events:/,$p'NAME READY STATUS RESTARTS AGE
web-6d9f7c8b5-4xk2p 0/1 CrashLoopBackOff 5 (40s ago) 4m
Events:
Warning BackOff 12s (x14 over 4m) kubelet Back-off restarting failed container web
Warning Failed 4m kubelet Error: configmap "web-config" not found
The sample events are illustrative. Read the status column first. Pending means no node was found (look for "Insufficient memory" or taint messages in events). ImagePullBackOff means the image name, tag or credentials are wrong. CrashLoopBackOff means the container starts and exits. CreateContainerConfigError points to a missing ConfigMap or Secret, as above.
Step 2: logs, including the dead container
kubectl logs web-6d9f7c8b5-4xk2p
kubectl logs web-6d9f7c8b5-4xk2p --previous
kubectl logs web-6d9f7c8b5-4xk2p -c sidecar --since=10m
kubectl logs -l app=web --all-containers --prefix --tail=20
When a container is restarting, the current log is often empty because it just started; --previous shows the run that crashed. Exit codes show in describe under "Last State": 137 is killed (often out of memory, see memory limits), 1 is an application error, 126 and 127 mean the command could not run, as in exit codes.
Step 3: get inside
kubectl exec -it web-6d9f7c8b5-4xk2p -- sh
kubectl debug -it web-6d9f7c8b5-4xk2p --image=busybox:1.37 --target=web
kubectl debug web-6d9f7c8b5-4xk2p -it --copy-to=web-debug --container=web -- sh
exec works when the image has a shell. Distroless and scratch images do not, and that is when kubectl debug helps: it attaches an ephemeral container with tools next to the app, sharing its process namespace with --target. The third form copies the pod and replaces the command, which lets you inspect an app that crashes at start. Clean up with kubectl delete pod web-debug.
Step 4: test the network path
kubectl port-forward pod/web-6d9f7c8b5-4xk2p 8080:8080 &
curl -s localhost:8080/health
kubectl get endpointslices -l kubernetes.io/service-name=web
kubectl run tmp --rm -it --image=busybox:1.37 --restart=Never -- wget -qO- http://web/health
Port-forward proves the app works, and a request through the Service name proves DNS and routing. Empty endpoints mean the Service selector does not match the pod labels or the pod is not ready. A readiness probe that fails keeps a pod out of the Service, a common cause of "running but unreachable"; see health checks. Network tools are in debugging network issues.
Read the pod's state before reaching for logs
The status column compresses a lot into one word, and each value points to a different cause. Pending means the scheduler has not placed the pod, usually because no node has enough CPU or memory, a taint blocks it, or a volume claim cannot bind. ImagePullBackOff means the node cannot fetch the image: a wrong tag, a private registry without a pull secret, or a network block. CrashLoopBackOff means the container starts and exits, and the kubelet is waiting longer between restarts. CreateContainerConfigError means a referenced ConfigMap or Secret is missing or a key inside it does not exist. Knowing this table saves several steps, because the first word usually tells you which part of the system to inspect.
The events at the bottom of kubectl describe pod are time-ordered and name the component that complained. Read them from the bottom up, and note the reason field, such as FailedScheduling or Unhealthy, which you can search for directly.
Exit codes and the last state
When a container has crashed, the describe output includes a last state with an exit code and a reason. Code 1 or another small number usually means the application failed on its own terms and the log explains why. Code 137 is a kill by signal 9, often the out-of-memory killer, and the reason field says OOMKilled when that is the cause. Code 143 is a graceful termination request that the process honoured. Code 126 and 127 mean the command could not be executed or was not found, which points at the image's entrypoint rather than the application.
Use these codes to decide whether to read logs or to change resource limits. A pod killed for memory has logs that look healthy until the end, and reading them longer will not help. Raising the limit, or finding the leak, will.
Debugging without a shell in the image
Minimal and distroless images have no shell, so kubectl exec cannot start one. Ephemeral containers solve this: kubectl debug -it POD --image=busybox --target=CONTAINER attaches a temporary container that shares the process namespace of the target, so you can inspect its processes, network and, through /proc/PID/root, its file system. The pod spec is not changed and the container is removed with the pod. Check that your cluster version and permissions allow ephemeral containers before an incident, not during one.
Another approach is kubectl debug POD --copy-to=copy --container=app -- sh, which makes a copy of the pod with a changed command. It keeps the original running while you experiment. For node-level problems, kubectl debug node/NAME starts a privileged pod on that node with the host file system mounted, so use it with care.
Work outward from the pod
If the pod is healthy but traffic does not reach it, the fault is in the layers around it. Check that the Service selector matches the pod labels, that the endpoints list contains the pod's address, that the readiness probe passes, and that the port numbers agree between container, Service and Ingress. A pod that is running but not ready receives no traffic, which looks like an outage while every container is fine. Test from a debug pod in the same namespace by calling the Service name, to separate DNS, Service routing and application problems.
Network policies add another layer. A policy that selects the pod and allows only certain sources will drop everything else without an error message. List the policies in the namespace when connections time out instead of being refused.
Keep a record and fix the cause
Capture what you found before restarting anything: the describe output, the previous container's logs with --previous, and the events. Restarting clears the evidence. Once the cause is clear, change the manifest in version control and apply it, instead of editing live objects, so the fix survives the next deploy. Add the missing check that would have caught it, such as a readiness probe that tests the real dependency, a resource request sized from measurement, or an admission rule that rejects images without a tag.
Where this does not apply
Prefer fixing the manifest to editing a live pod: changes made with exec vanish on restart. Production access may be restricted, so rely on logs and metrics there. Node-level problems need kubectl describe node and kubectl get events -A --sort-by=.lastTimestamp. Ephemeral containers require a cluster that supports them, stable since 1.25. See the debug running pods guide and the kubectl debug reference.