How to Use Docker Debug and Ephemeral Debug Containers
Debug minimal and distroless containers with docker debug, toolbox containers that share namespaces, and kubectl debug ephemeral containers.
The recommended way to ship an image is small: distroless or scratch, no shell, no package manager. That makes the container hard to inspect when something goes wrong, because docker exec -it app sh fails with "executable file not found". The fix is to bring the tools in a different container that looks at the same things. The commands use Docker Engine 27 and kubectl 1.31; the failure-side debugging is in containers that exit immediately.
Share namespaces with a toolbox container
docker run -it --rm \
  --pid=container:app \
  --net=container:app \
nicolaka/netshoot app-6c9f:~# ps aux
PID USER COMMAND
1 65532 /app/server --port 8080
17 root zsh
app-6c9f:~# ss -tlnp
LISTEN 0 4096 *:8080 *:* users:(("server",pid=1,fd=3))
--pid=container:app lets the toolbox see the target's processes, and --net=container:app puts it in the same network namespace, so ss, curl localhost and tcpdump see what the application sees. The target container is not modified and does not restart. The root filesystem of the target is reachable at /proc/1/root if the user ID allows it, which lets you read its files; add --cap-add SYS_PTRACE for tools that need to attach to the process, which grants real power, so leave it out unless needed.
docker debug
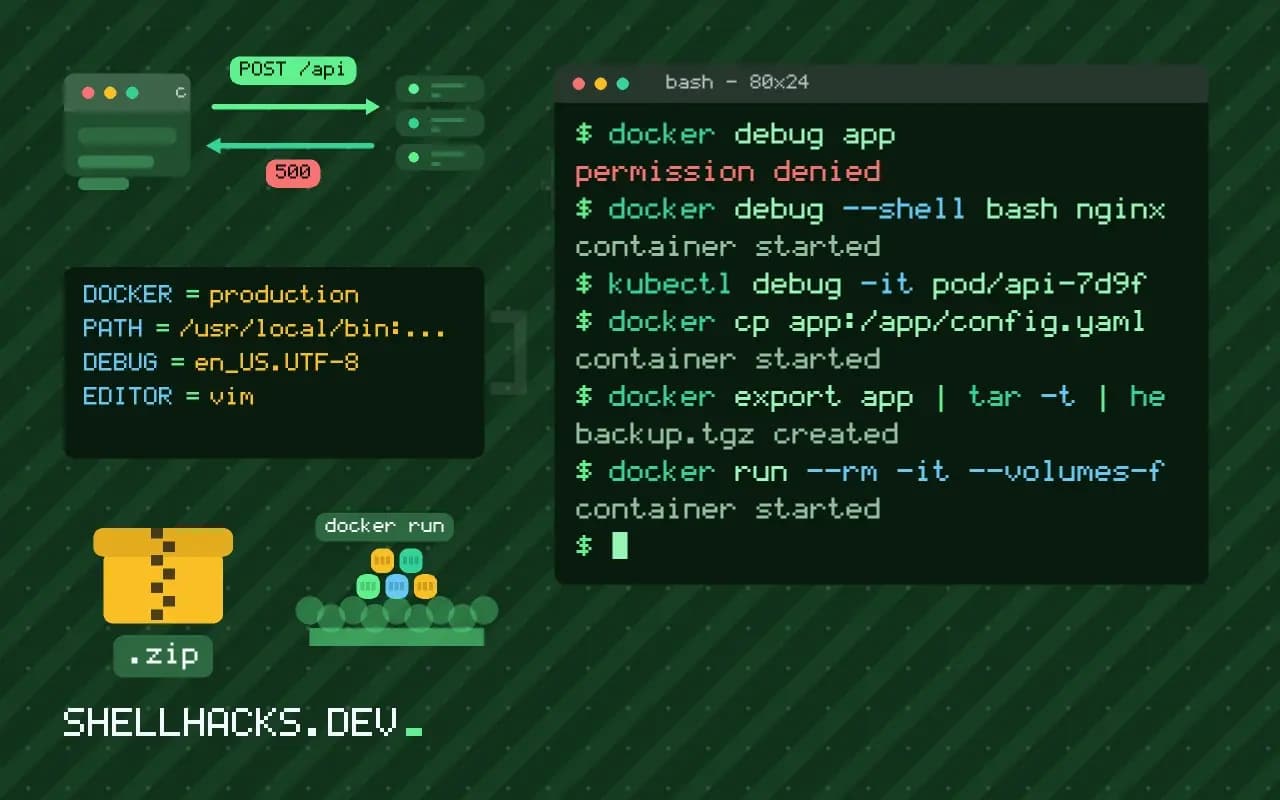
docker debug app
docker debug --shell bash nginx:1.27
Docker's own docker debug command, available in Docker Desktop and recent CLI releases, attaches a toolbox with a shell, common utilities and a persistent home to a container or even an image, and works on containers with no shell at all. It is a subscription feature, so check your plan before relying on it, and the open alternative is the manual method above. See the docker debug reference for details.
Kubernetes ephemeral containers
kubectl debug -it pod/api-7d9f --image=nicolaka/netshoot --target=api
kubectl debug pod/api-7d9f -it --copy-to=api-debug --container=api --image=busybox -- sh
An ephemeral container is added to a running pod and shares its network and, with --target, the process namespace of one container. The second form copies the pod and changes its image, useful when you want a shell in a modified copy and keep the original running. Ephemeral containers cannot be removed from a pod once added; they stay until the pod is deleted. See debugging a Kubernetes pod from the terminal.
Read the filesystem without a shell
docker cp app:/app/config.yaml ./
docker export app | tar -t | head
docker run --rm -it --volumes-from app --entrypoint sh alpine
For files, docker cp needs no tools in the container, and --volumes-from in a helper container shows the same volumes. A helper cannot see the target's own layers, only its volumes. The copy method is described in docker cp.
Why minimal images need a different approach
A distroless or scratch image contains only the application and what it needs to run: no shell, no package manager, often no ls. That is good for security and size, since an attacker who gets code execution has fewer tools, and the number of components that need patching is small. It also means the usual advice to exec into the container and look around does not work, because there is no shell to start. The debug approaches share one idea: keep the production image unchanged and bring the tools from outside, in a separate container that attaches to the same namespaces. The debugging tools never become part of the artifact that ships.
The alternative, adding a shell to the image "just in case", trades away the benefits and tends to stay forever. A build target for a debug variant, with the same application and a shell added, is a compromise that some teams use for staging. The ephemeral container method is better for production, since the running pod or container is the one that has the problem, and a restart into another image may make it vanish.
What the shared namespaces give you
Sharing the network namespace puts the toolbox on the same interfaces and ports, so ss, tcpdump, curl localhost and dig see what the application sees. Sharing the PID namespace lets the toolbox list the application's processes, read /proc/PID/, run strace -p and send signals. The filesystem is not shared: the toolbox has its own root, but the application's root is reachable through /proc/PID/root, which allows reading its files with ordinary tools when permissions permit. Tracing needs the SYS_PTRACE capability and a security profile that allows it, which are off by default and have to be added to the debug container deliberately.
Common investigations
A few recipes cover most cases. For "why can't it connect", run ss -tnp to see connections and curl -v against the dependency from inside the namespace, then dig to test name resolution with the container's resolver configuration. For "what is it doing right now", use strace -f -p 1 -e trace=network,file briefly, or read /proc/1/status and /proc/1/limits for memory and file descriptor use. For "what is in its environment", read /proc/1/environ, with the caution that it contains secrets. For "why is it slow", look at CPU and disk use with top and iostat, and at the cgroup limits for throttling in /sys/fs/cgroup.
Operating practices
Treat debug access as a privileged action. Restrict who can start ephemeral containers through role-based access control, log every use, and remove the debug container when done. Copy findings out of the session, since an ephemeral container is gone when the pod restarts. Choose a toolbox image from a source you trust and pin its tag or digest, as it runs next to production secrets, and keep a copy in your own registry so an incident does not depend on a public one. Rehearse the commands on a test workload before the first real incident.
Limits of the technique
Namespace sharing shows what the application sees from the network and the process table, and it cannot show everything. Without a shared filesystem, anything inside the application's container that is not reachable through /proc/PID/root is invisible, and a process that has dropped privileges may make its root unreadable to the toolbox. Kernel-level tracing needs host access, and managed platforms may forbid ephemeral containers altogether, in which case the answer is better logging and metrics built into the application. Treat the toolbox as the last step after structured logs, metrics and traces have narrowed the question, since those are available to everyone and leave a record.
Where this does not apply
Namespace sharing is a debugging tool, not a monitoring approach: a toolbox with SYS_PTRACE can inspect and alter secrets in memory, so use it only where you are allowed to, and remove it when done. Rootless engines and some hardened hosts restrict --pid=container. For recurring needs, log and metric output from the application is the better fix, as discussed in observability versus monitoring. See also the Kubernetes ephemeral container documentation.