How to Use time to Measure a Command the Right Way
Use the time command to measure real, user and system time, the difference between the keyword and /usr/bin/time, memory with -v, and averaging runs.
"Which version is faster?" is answered by measurement, and time is the simplest instrument. Understanding what the three numbers mean prevents the most common misreading, and it leads into the benchmark discipline in writing a benchmark you can trust. The examples assume Bash 5.2 and GNU time 1.9.
Read real, user and sys
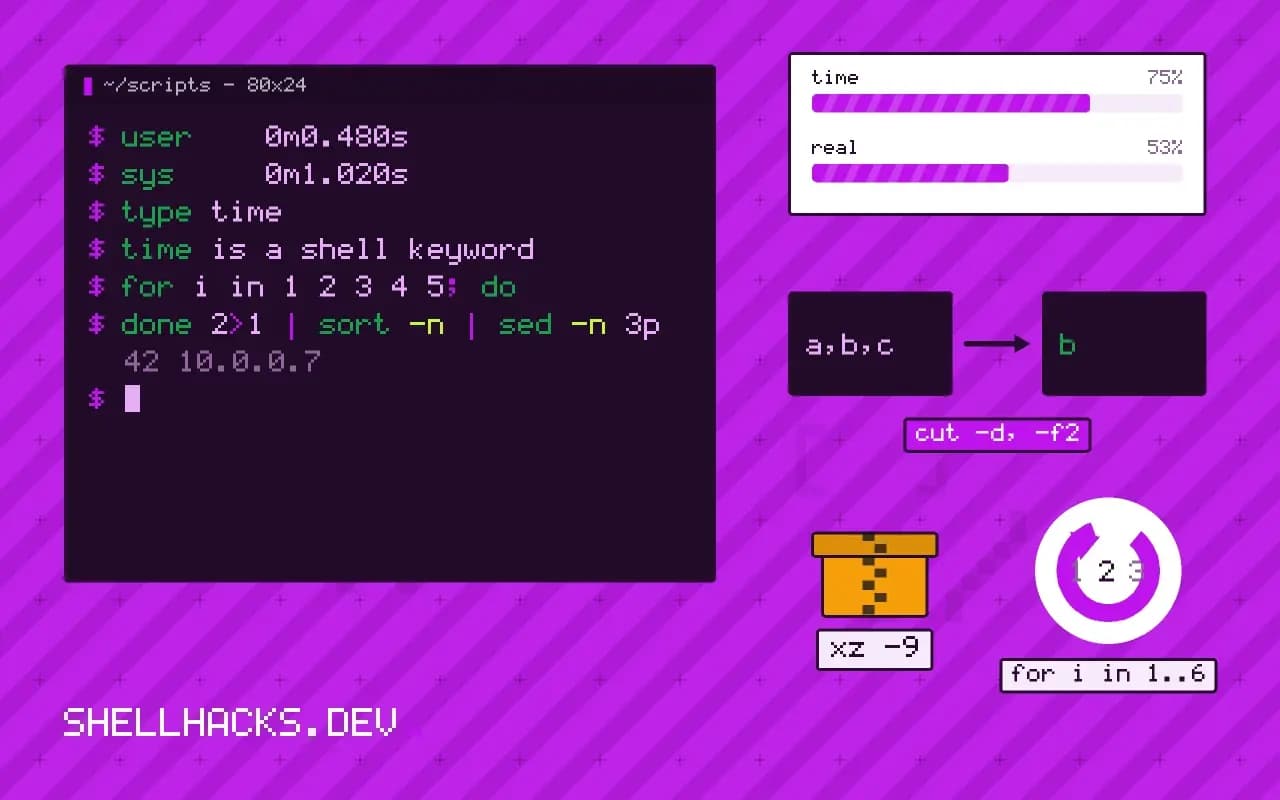
time sleep 2
time find / -name '*.conf' 2>/dev/null | wc -lreal 0m2.003s
user 0m0.001s
sys 0m0.002s
1243
real 0m3.412s
user 0m0.480s
sys 0m1.020s
sleep spends two seconds of wall time doing nothing, so user and sys are tiny. The find run spent most of its real time waiting on the disk: 3.4 seconds elapsed against 1.5 seconds of CPU. With several threads, user plus sys can exceed real, because CPU time adds across cores.
Keyword versus external program
type time
/usr/bin/time -v ls /usr/lib > /dev/nulltime is a shell keyword
Command being timed: "ls /usr/lib"
User time (seconds): 0.00
System time (seconds): 0.00
Maximum resident set size (kbytes): 3584
Minor (reclaiming a frame) page faults: 148
Elapsed (wall clock) time (h:mm:ss or m:ss): 0:00.00
In Bash, time is a keyword that times an entire pipeline or compound command and prints in the format set by TIMEFORMAT. The external /usr/bin/time is a separate program that times one command and with -v adds peak memory, context switches and page faults. Use it to find a memory-hungry step; the output goes to stderr, so redirect it with -o file when you also capture the command's output. See usr/bin/time -v for more on the fields.
Repeat and average
for i in 1 2 3 4 5; do
  /usr/bin/time -f '%e' ./build.sh > /dev/null
done 2>&1 | sort -n | sed -n 3p
A single run is a sample of one. The first run fills file and CPU caches, later ones run faster, and other processes add noise. Taking the median of five runs gives a steadier figure. For serious comparison, hyperfine does warmups, many runs and statistics automatically, as shown in performance regression checks.
Custom output
TIMEFORMAT='took %R s (cpu %U + %S)'
time tar -czf /tmp/test.tgz /usr/share/doc 2>/dev/nulltook 4.210 s (cpu 3.880 + 0.290)
The keyword's format string uses %R for real, %U for user and %S for system time, with %P for CPU percentage. Setting it in a script gives machine-readable lines that you can append to a log to track a task's duration over weeks.
What real, user and sys actually mean
The three numbers answer different questions. Real is wall-clock time from start to finish, which is what a person waiting at the terminal experiences. User is the CPU time the process spent executing its own code, summed across all its threads, and sys is the CPU time the kernel spent on its behalf, in system calls such as reading files and allocating memory. On a single core, user plus sys cannot exceed real. On a multi-core machine a parallel program can have user plus sys several times larger than real, because several cores work at once. A real time much larger than user plus sys means the process spent its time waiting, for disk, network, locks or another process, and tuning the code will not help; the wait is the problem.
This distinction decides where to look. A job with high user time is compute-bound and benefits from a better algorithm or more cores. A job with high sys time is doing many system calls, often tiny reads and writes, and benefits from larger buffers. A job with low CPU and high real time needs a look at its dependencies.
Why one measurement is not enough
A single run is noisy. The first run of a command reads files from disk, while later runs find them in the page cache and finish much faster. CPU frequency scaling, other processes on the machine and thermal limits all change results from one run to the next. To compare two commands fairly, run each several times, discard the first run if the cache state is not what you want to test, and look at the spread as well as the average. Tools such as hyperfine automate warm-up runs and statistics, and print the mean with the standard deviation and the range. For quick checks, a shell loop and the minimum of five runs is a decent estimate of the cost without interference.
State the conditions when reporting numbers: the hardware, whether the cache was warm, the input size and the version of the tool. A claim that one command is faster is meaningless without them.
Measuring pipelines and subshells
The Bash keyword time can time a whole pipeline, which the external program cannot, because the keyword is parsed by the shell before the pipeline is built. Write time cmd1 | cmd2 and the result covers both. To time a group of commands, wrap them in braces or a subshell. The report goes to the shell's standard error, so redirecting the command's error output does not capture it; wrap the timing in braces and redirect the group instead. Setting the TIMEFORMAT variable changes the layout, and a value like %R prints only the real time in seconds, convenient for scripts that log durations.
The external /usr/bin/time -v prints much more than the keyword: maximum resident memory, page faults, context switches and file system operations. That makes it the tool to reach for when the question is memory use, not only time.
Using the numbers well
Put timing into automated checks with care. A threshold on elapsed time in CI is flaky on shared runners, where neighbours steal CPU. Compare against a baseline measured on the same machine in the same job, use a generous margin, or measure instructions or allocations, which vary less than time. For long-running jobs, log durations to a file or a metrics system and look at trends, since a gradual rise from 40 seconds to 90 over a month is a finding that no single run reveals. When a result is surprising, check the basics before believing it: that the command ran the code path you intended, that output was not cached and that the machine was otherwise idle. Benchmarks that survive these questions are the ones worth acting on.
Where this does not apply
time measures the whole command, including startup and disk IO wait, so it cannot say which function is slow; use a profiler for that. Timing very short commands is unreliable because the timer resolution and process start-up dominate. Cached results and CPU frequency scaling make laptops noisy, so compare on an otherwise idle machine. The Bash manual on pipelines describes the keyword and TIMEFORMAT, and the time manual page covers GNU time.
One last habit: always redirect the command's output when timing. Printing thousands of lines to the terminal measures the terminal, not the command, so send output to /dev/null unless the output is what you are measuring.