How to Use time and usr bin time v for Memory and CPU
Measure time and memory of a command with GNU time: wall clock, CPU, peak memory, page faults, custom formats, logging runs and macOS differences.
Every shell has a time command that says how long something took, and only the GNU one in /usr/bin also says how much memory it needed. The two behave differently, and picking the wrong one is the usual reason the memory line is missing. This post uses the GNU tool for time and peak memory and shows how to read the output. It is a quick way to start before measuring memory in more detail and profiling with perf. Examples use GNU time 1.9 on Debian 13.
The verbose report
sudo apt install time
/usr/bin/time -v sort -S 1G big.txt > /dev/null Command being timed: "sort -S 1G big.txt"
User time (seconds): 14.82
System time (seconds): 2.11
Percent of CPU this job got: 118%
Elapsed (wall clock) time (h:mm:ss or m:ss): 0:14.31
Maximum resident set size (kbytes): 1052412
Major (requiring IO) page faults: 0
Minor (reclaiming a frame) page faults: 264811
Voluntary context switches: 241
Involuntary context switches: 1180
Exit status: 0
The report comes on stderr, so it is not mixed into redirected output. User time is CPU spent in the program's code, system time in the kernel on its behalf; their sum is the CPU time. "Percent of CPU" above 100 means the program used more than one core. Maximum resident set size is the peak physical memory in kilobytes, here about 1 GB, matching the -S 1G buffer. A non-zero count of major page faults means the program had to read from disk for memory, a sign of memory pressure.
Real versus CPU time
If the elapsed time is much larger than user plus system, the command spent its time waiting, for the disk, the network, a lock or another process. If they are about equal, it was computing. Here, 14.31 seconds elapsed against 16.93 of CPU over 118 percent shows computation on more than one thread. That one comparison tells you which kind of tuning is worth trying, and it is covered further in finding the slow part of a pipeline.
Custom format and logging
/usr/bin/time -f '%e s elapsed, %U user, %S sys, %M KB peak' ./build.sh
/usr/bin/time -o runs.log -a -f '%e %M %C' ./build.sh
tail -n 3 runs.log41.30 s elapsed, 36.10 user, 4.52 sys, 2210788 KB peak
41.30 2210788 ./build.sh
39.87 2205112 ./build.sh
The format codes: %e elapsed seconds, %U user, %S system, %M peak KB, %P percent CPU, %x exit status, %C the command. -o file -a appends one line per run, which builds a history you can compare after a change or feed to awk for an average. Run each variant several times; one run is an anecdote.
Shell time versus the program
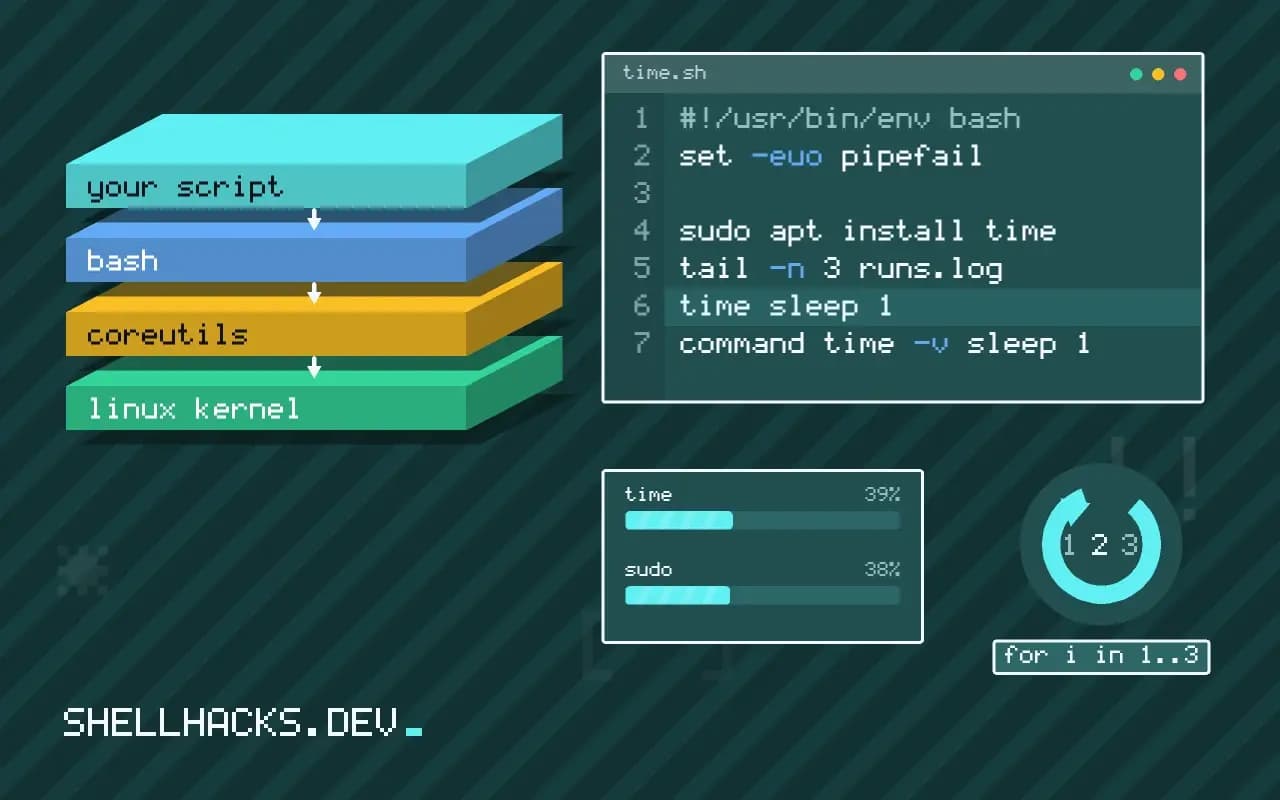
time sleep 1
command time -v sleep 1
type -a time
In Bash, time is a reserved word that times a whole pipeline and prints three lines, controlled by the TIMEFORMAT variable. It cannot show memory. Writing /usr/bin/time or command time bypasses the keyword. The keyword has one advantage: it times an entire pipeline, such as time (a | b | c), where the program times only the one command after it.
Child processes and other systems
GNU time reports the command and the children it waited for. A program that starts a daemon and exits misses the daemon's usage. Peak memory is the largest of the process tree measured by the kernel's accounting, which can read lower than the sum of simultaneous children. On macOS the command is /usr/bin/time -l and reports memory in bytes; BSD time lacks -v and -f. Busybox time is minimal. Alpine needs apk add time.
Where this does not apply
It gives one summary per run, not a profile over time. For memory growth during a long run, sample the process as shown in finding memory leaks in long-running scripts. For comparisons between commands with proper statistics, hyperfine runs each many times with warmups; see benchmarking shell commands.
Reading the verbose report line by line
The GNU time program, run as /usr/bin/time -v command, prints about twenty measurements after the command finishes. The ones that matter most are the elapsed wall-clock time, the user and system CPU times, the maximum resident set size, the page fault counts and the context switch counts. Elapsed is what a stopwatch would show. User is the CPU time the process and its waited-for children spent in their own code, and system is the time the kernel spent on their behalf. When elapsed is much larger than user plus system, the program was waiting, for disk, network, locks or a sleep. When user plus system is larger than elapsed, it used more than one core. The maximum resident set size is the peak memory held in RAM, reported in kilobytes on Linux, and it is the number to use when choosing a memory limit. Major page faults count reads from disk to satisfy a memory access, and a large number means the program was paging or reading a cold file.
Voluntary context switches show how often the process gave up the CPU to wait, and involuntary ones how often the scheduler took it away. A high involuntary count means the process was competing for CPU with others.
Shell builtin, binary and other systems
There are two things called time, and they differ. Bash's keyword prints real, user and sys times in a short format and can time a whole pipeline, and it does not accept options like -v. The separate binary at /usr/bin/time is the one with the detailed report. Typing the command name alone in Bash gives you the keyword, so to run the binary, write the full path or prefix the command with a backslash. The package is called time on Debian and Ubuntu, and a minimal container may not have it installed. BusyBox, the base of Alpine images, ships a smaller time that lacks -v. On macOS, the BSD version uses -l for a similar report, and it prints the maximum resident size in bytes and not kilobytes, a difference that causes a factor of 1024 mistake when scripts parse both. Parsing the output reliably is easier with the format option and a custom string than with the verbose text, which varies between versions.
The figures include children the command waited for, since they come from the operating system's accounting for terminated children, but not processes that were started in the background and outlive the command.
Logging results and avoiding misreadings
For repeated measurements, use -f with a format such as elapsed, user, system and peak memory separated by tabs, and -o file -a to append each run to a log you can load into a spreadsheet. Run each measurement several times and use the median, since the first run pays for cold caches and later runs benefit from the page cache, so a single number conflates two situations. Say which one you measured. Close other heavy programs while measuring, or at least note the load. When comparing two versions of a script, alternate runs of the two instead of running all of one and then the other, so drift in machine state affects both equally. Remember what the numbers do not say: a small peak memory with high time could be a program doing slow work in a small space, and neither number points to the line of code responsible. For that, profile, and use time to decide whether the effort is justified and to confirm afterward that it worked.
See the GNU time manual and getrusage(2), the system call it uses.