How to Find Memory Leaks in Long Running Scripts Properly
Find memory leaks in long running scripts: sample resident memory to a log, take Python tracemalloc snapshots, check Bash and contain a leak.
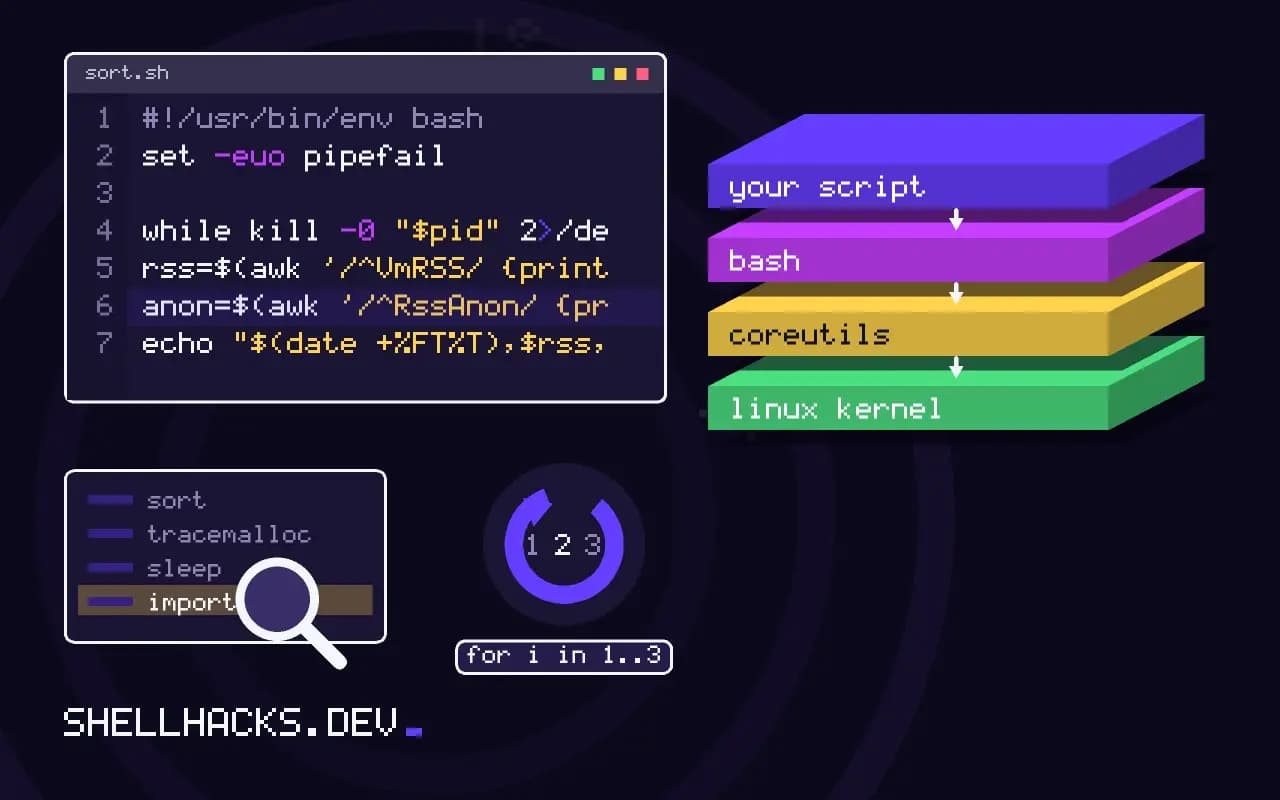
A script that works for an hour and dies after three days with "Killed" in the log has a memory problem, and the symptom is far from the cause. Finding it is a two-step job: prove that memory grows, then find what holds it. This post gives a simple sampler for the first step and language-specific tools for the second. It builds on measuring memory use. Examples use Python 3.13, Bash 5.2 and Linux 6.12.
Prove the growth
#!/usr/bin/env bash
pid=$1; out=${2:-rss.csv}
echo "time,rss_kb,anon_kb" > "$out"
while kill -0 "$pid" 2>/dev/null; do
  rss=$(awk '/^VmRSS/ {print $2}' /proc/"$pid"/status)
  anon=$(awk '/^RssAnon/ {print $2}' /proc/"$pid"/status)
  echo "$(date +%FT%T),$rss,$anon" >> "$out"
  sleep 60
done./rss-log.sh "$(pgrep -f worker.py)" &
awk -F, 'NR>1 {print $2}' rss.csv | awk 'NR==1 {first=$1} END {printf "grew %d KB over %d samples\n", $1-first, NR}'A leak looks like a line that keeps climbing as long as the program keeps working, and does not come down when the load drops. Normal behavior is a rise at startup, then a plateau, with ups and downs as caches fill and are freed. Memory that is allocated and kept for reuse, such as a cache with a size limit, rises and levels off; a leak never levels off. Watch for at least several hours, with real load. Sampling RssAnon excludes mapped files and is a cleaner signal.
Python: find what grows
import tracemalloc

tracemalloc.start(10)
baseline = tracemalloc.take_snapshot()

def report():
    snap = tracemalloc.take_snapshot()
    for stat in snap.compare_to(baseline, "lineno")[:8]:
print(stat)worker.py:42: size=48.2 MiB (+48.1 MiB), count=412300 (+412290), average=123 B
worker.py:17: size=3112 KiB (+3100 KiB), count=9120 (+9100), average=349 B
tracemalloc records where each live allocation came from. Comparing a snapshot after a period of work with the baseline lists the lines whose allocations grew most. Line 42 above gained 48 MB and 412,000 objects, a list or dict that is appended to and never cleared. Start it with python -X tracemalloc=10 to avoid editing the code, and print the report from a signal handler or a timer. It slows the program, so use it on a test instance.
Frequent Python causes: a module-level list used as a log, a dictionary used as a cache without eviction (use functools.lru_cache(maxsize=...)), a reference cycle with a __del__, exception tracebacks stored in a list, and connections or file handles that are never closed.
Bash scripts
declare -p results | wc -c
while read -r line; do
  results+=("$line")        # grows without bound
done < /dev/stdin
Bash itself rarely leaks, and a script's memory grows when it stores data: an array or variable appended in a loop that never ends. declare -p array | wc -c shows how big a variable has become. A subshell started in a loop is a separate process and exits when done, so check for background jobs that are never waited for with jobs and ps --ppid $$. For a pipeline processing a stream, memory stays flat if each stage reads and writes line by line; a stage like sort or tac holds everything.
Native programs and mappings
pmap -x "$pid" | sort -k3 -n | tail -n 5
valgrind --tool=massif ./app
cat /proc/"$pid"/smaps_rollup | grep -E 'Anonymous|Rss'
pmap -x lists mappings with their resident size; a heap or an anonymous region that grows between two samples shows where the memory is. valgrind --tool=massif profiles heap allocations of C and C++ programs; Go programs have pprof heap profiles through net/http/pprof, and Node has --inspect with heap snapshots.
Contain it while you fix it
[Service]
MemoryHigh=900M
MemoryMax=1G
Restart=on-failure
RestartSec=5
MemoryHigh starts throttling the service when it passes the limit and MemoryMax kills it, after which Restart brings it back. This turns a crash that takes the host down into a restart every few days. It is a mitigation, not a fix, and a restart policy that hides a leak is a cost you pay later. See capping runaway jobs.
Where this does not apply
Growth that levels off is a cache or buffer, not a leak. Fragmentation can make RSS grow slowly in programs that allocate and free varied sizes, and it looks like a leak without being one: the fix there is a different allocator, such as jemalloc. The Linux page cache is also not a process leak, and shows in free as cache, not as process memory.
Related reading: time and peak memory with GNU time gives the one-number check, and speeding up shell scripts covers changes that reduce the amount held at once, such as streaming instead of collecting.
Separating a leak from normal growth
Memory use that rises is not necessarily a leak. A program that caches results grows until the cache fills, the kernel's page cache grows with file reads and is given back on demand, and a memory allocator may keep freed memory for reuse and not return it to the system. A leak is growth with no upper bound that tracks the amount of work done. Establish it by measuring the resident size at fixed intervals while the program runs under steady load, for hours if needed, and plotting it. A staircase that rises with each batch and never falls is suspicious. A curve that climbs and levels off is a cache or a warm-up. A sawtooth that returns to a baseline is normal garbage collection. Keep the workload constant so any trend is the program's and not the traffic's. If the growth stops when the load stops, it is tied to requests, and the cause is in what each request keeps. This step is the one most often skipped, and skipping it leads to hours spent fixing a program that was behaving.
Check the pattern against what the program does with time. A job that accumulates results in a list until the end will grow by design, and the right fix is to stream the results to disk, not to hunt for a leak.
Finding the owner of the growth in Python and the shell
In Python, the standard library module tracemalloc records where each allocation was made. Take a snapshot early and another later, compare them with compare_to and sort by size difference, and the lines of code that allocated the growing objects appear at the top. For object graphs, a package such as objgraph shows which types are increasing and what refers to them, which finds the dictionary or list that nothing clears. The usual causes are a module-level cache without a size limit, a list that collects results in a long-running loop, callbacks or handlers registered on every request and never removed, and reference cycles holding large objects until the collector runs. In Bash, growth almost always comes from variables and arrays that keep appending, from a loop that builds a string, or from a pipeline that reads a whole file into a variable. Check the shell's own size with ps, print variable sizes with declare -p, and look for the loop that adds to something and never resets it.
A script that spawns a subshell or a background job per iteration and never waits for them leaves processes that each use memory, and the sum, not any one process, is what grows.
Native code and what to do while you fix it
For programs written in C, C++, Rust with unsafe code or extensions, valgrind --leak-check=full reports memory that was allocated and never freed at exit, with stacks, at the cost of running ten to fifty times slower. heaptrack and the allocator's own profiling hooks work on a live program with less slowdown and show allocation sites over time. Beware of the cases that are not leaks: memory held by the allocator after frees, which glibc can hold per thread in separate arenas, and which MALLOC_ARENA_MAX limits, and memory fragmentation, where the program's live data is small and the process stays large because free space is scattered. Mapped files count toward RSS when touched, so a program that reads a large file through mmap appears to grow. Check /proc/PID/smaps to see which mappings are growing, because a heap that grows and a growing set of file mappings point to different causes.
While the fix is in progress, contain the damage: set a memory limit with the service manager so the process is restarted cleanly and not allowed to take down the machine, and alert on the growth rate, so you know before the limit is hit.
See the tracemalloc documentation and pmap(1).