How to Measure Memory Use of a Command Step by Step
Measure the memory a command uses on Linux: peak RSS with GNU time, /proc status, PSS with smem, sampling a process and cgroup peak.
"How much memory does it use?" has several honest answers. The figure in the task list is the resident size, which counts pages shared with other processes; the virtual size is usually enormous and means little; and the peak matters more than the average, because the peak is what triggers the out-of-memory killer. This post goes through the tools in order of effort, starting with the simplest and ending with the one that handles process trees. It extends time and /usr/bin/time -v. Examples use Linux 6.12 and procps 4.0.
Peak of one command
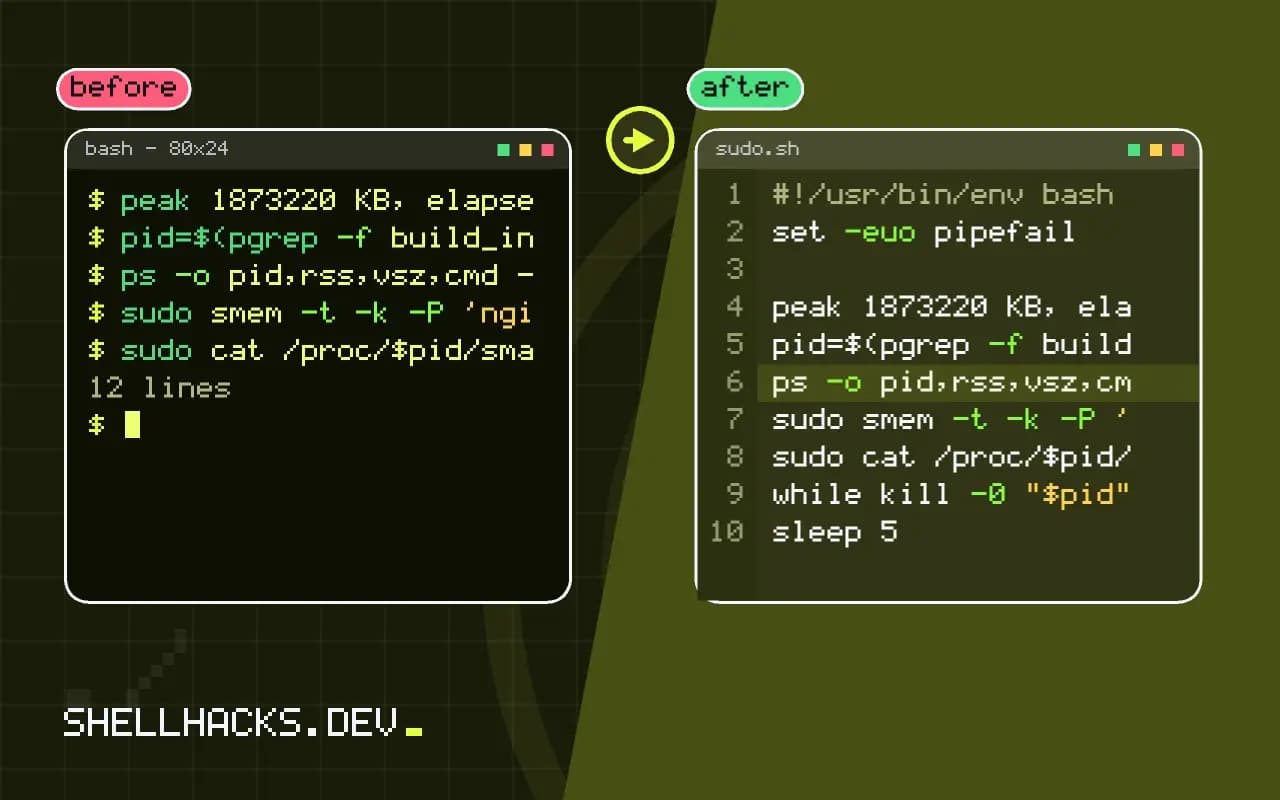
/usr/bin/time -f 'peak %M KB, elapsed %e s' python3 build_index.pypeak 1873220 KB, elapsed 38.2 s
This is the simplest answer: the highest resident size reached during the run, about 1.8 GB. It works for any command with no setup.
A running process
pid=$(pgrep -f build_index.py | head -n1)
grep -E 'VmPeak|VmSize|VmHWM|VmRSS|RssAnon|RssFile|RssShmem' /proc/$pid/status
ps -o pid,rss,vsz,cmd -p "$pid"VmPeak: 3412204 kB
VmSize: 3398112 kB
VmHWM: 1873220 kB
VmRSS: 1650444 kB
RssAnon: 1612300 kB
RssFile: 38144 kB
VmHWM is the peak resident size so far, VmRSS is the current one, and VmSize and VmPeak are virtual. Split into RssAnon (memory the program allocated), RssFile (mapped files such as libraries) and RssShmem (shared memory). When you are asking whether a program leaks or needs a bigger machine, RssAnon is the number to watch.
Fair shares with PSS
sudo smem -t -k -P 'nginx|php-fpm'
sudo cat /proc/$pid/smaps_rollup | grep -E 'Pss|Rss'
Twenty worker processes that share one copy of a large library each show that library in their RSS, so adding up RSS overstates the total badly. PSS (proportional set size) divides each shared page by the number of processes that map it, so the PSS of all processes sums to real usage. smem reports it per process; /proc/PID/smaps_rollup gives one process's total without extra tools.
A whole process tree
systemd-run --user --scope -p MemoryMax=infinity --unit=memtest ./build-all.sh
cat /sys/fs/cgroup/user.slice/user-$UID.slice/user@$UID.service/app.slice/memtest.scope/memory.peak
A build that starts compilers, linkers and helpers has no single process to measure. Running it in a systemd scope puts every child in one cgroup, and the kernel records the peak memory of the whole group in memory.peak (available since Linux 5.19). The path depends on your session; systemd-cgls shows it. A scope that ends is removed, so read the file while it exists or use --property=RemainAfterExit where supported, or sample memory.current in a loop.
Sample over time
while kill -0 "$pid" 2>/dev/null; do
  printf '%s %s\n' "$(date +%T)" "$(awk '/VmRSS/ {print $2}' /proc/$pid/status)"
  sleep 5
done | tee rss.log
A log of resident size over time shows the shape: a plateau, a steady climb or a sawtooth. It is the first step in finding a memory leak. For a plot, feed it to gnuplot or a spreadsheet.
Where this does not apply
RSS does not include memory that has been swapped out, so a process under pressure can look small while its working set lives in swap; check VmSwap. Memory-mapped file reads inflate RSS without using anonymous memory, and the kernel can drop those pages freely. Containers need the container's cgroup, not the host's view. For allocation-level detail, tools like valgrind --tool=massif or the language's own heap profiler show who allocated. For capping usage, see capping jobs with cgroups.
Which number to trust
"How much memory does this use" has several answers, and they differ by large factors. The virtual size counts every address the process has mapped, including libraries, reserved but untouched memory and files mapped from disk, and it is usually far bigger than the real use, so it is rarely the right figure. The resident set size, RSS, counts pages currently in RAM, which is closer, but it counts shared pages, such as a library used by twenty processes, in full for each of them, so adding up the RSS of many processes overstates the total. The proportional set size, PSS, divides each shared page among the processes that use it, which makes the sum across processes correct, and is the right measure for questions like how much memory a group of workers really uses. The peak resident size, also called the high-water mark, is what you need to set a limit, since a limit below the peak will kill the program. Know which of these you are looking at before you make a decision from it.
The kernel files make this concrete: /proc/PID/status holds VmRSS for the current resident size, VmHWM for the peak, and VmPeak for the peak virtual size, and /proc/PID/smaps_rollup gives PSS in a summary.
Measuring a single run and a running process
For a command that starts and ends, /usr/bin/time -v reports the maximum resident set size in one line, which is the cheapest and most reliable peak measurement. For a long-running process, read VmRSS and VmHWM from its status file, or use ps -o rss,vsz,cmd -p PID for a snapshot. Sampling once a second in a loop with a timestamp gives a time series that you can plot, and shows whether memory climbs, plateaus or oscillates, which is far more informative than one number. When the question is about a service in a container or a systemd unit, the control group has the answer for the whole group: in cgroup version 2, memory.current is the present use and memory.peak, available on kernels from 5.19, is the high-water mark, and both include the page cache that the group's processes caused, which is counted against the limit and is reclaimable. That distinction explains cases where a container looks close to its limit and is fine, since much of it is cache.
Whole trees, sampling and the caveats
A script that spawns workers, or a build tool that runs compilers, uses memory in many processes, and the peak of the sum is not the sum of the peaks, because the processes may not peak together. To measure a tree, put it in a cgroup, for example with systemd-run --scope and read the group's peak, or sample the sum of PSS over all descendants at intervals with smem or a loop over /proc. Sampling can miss a short spike between samples, so for a hard guarantee use the kernel's own high-water mark. Memory measurements also vary with the allocator and the input, so measure with realistic data, not a toy file. Fragmentation can keep memory held by a process even after the program has freed it, so a number that stays high after the work is done does not by itself prove a leak. And check free memory the right way: free -m shows an available column that estimates what could be given to a new program, which is the number to read, and not the free column.
Limits you can enforce from these numbers
Once you know a command's peak, you can set a limit with confidence. A cgroup memory ceiling a little above the peak protects the rest of the machine from a runaway version of the same job, and an alert at eighty percent of the limit gives you time to raise it before the job is killed. Record the measured peak with the input size and the date, since memory use usually scales with the data, and the figure from last year's input is wrong this year. If two numbers disagree, such as the peak from time and the group's peak, the difference is usually the page cache or child processes, and understanding the gap is part of understanding the program.
See the kernel proc filesystem documentation and cgroup v2 memory controller.